Monitoring the condition of crops throughout the growing season is one of the key challenges in modern agriculture. The human eye is not always able to detect early signs of stress, nutrient deficiency, or disease — especially across large areas. This is where the NDVI vegetation index comes in, allowing farmers to assess crop health remotely using satellite imagery.
In this article, you will learn what NDVI is, how it is calculated, and why regular analysis of this index can make a real difference to the profitability of your farm.
What is the NDVI vegetation index and what are its benefits?
NDVI (Normalized Difference Vegetation Index) is a numerical indicator that describes the condition and vigor of vegetation based on the way plants reflect light. Healthy, actively photosynthesizing plants strongly reflect near-infrared radiation (NIR) while absorbing visible red light (VIS). The greater the difference between these two values, the healthier and more vigorous the vegetation.
Regular use of the NDVI index on your farm offers a range of practical benefits:
- Crop condition monitoring — NDVI lets you continuously track how your crops are developing across the entire field, without the need for time-consuming inspections on foot.
- Early problem detection — a drop in the index value in a specific area may indicate water stress, nutrient deficiency, disease, or pest damage long before symptoms become visible to the naked eye.
- Fertilization optimization — NDVI maps help identify zones that require more or less fertilizer, enabling variable-rate application and reducing unnecessary costs.
- Preventive crop protection — by spotting weak zones early, you can apply targeted treatments and prevent problems from spreading across the entire field.
- Time and money savings — instead of inspecting the whole field manually, you can focus your attention and resources exactly where they are needed most.
How does NDVI work?
The NDVI index is based on a simple principle: healthy plants reflect a lot of near-infrared light (NIR) and absorb most visible red light (VIS). Stressed, damaged, or dead vegetation reflects less NIR and more red light.
The NDVI value is calculated using the following formula:
NDVI = (NIR − VIS) / (NIR + VIS)
The result falls within a range from −1 to +1:
- Values below 0 — typically indicate water, snow, clouds, or artificial surfaces.
- Values around 0 to 0.2 — bare soil, rocks, or very sparse vegetation.
- Values from 0.2 to 0.5 — sparse or moderately developed vegetation, grasslands, or crops in early growth stages.
- Values from 0.5 to 0.7 — well-developed, healthy vegetation.
- Values above 0.7 — very vigorous, dense, and healthy plant cover — the best possible condition.
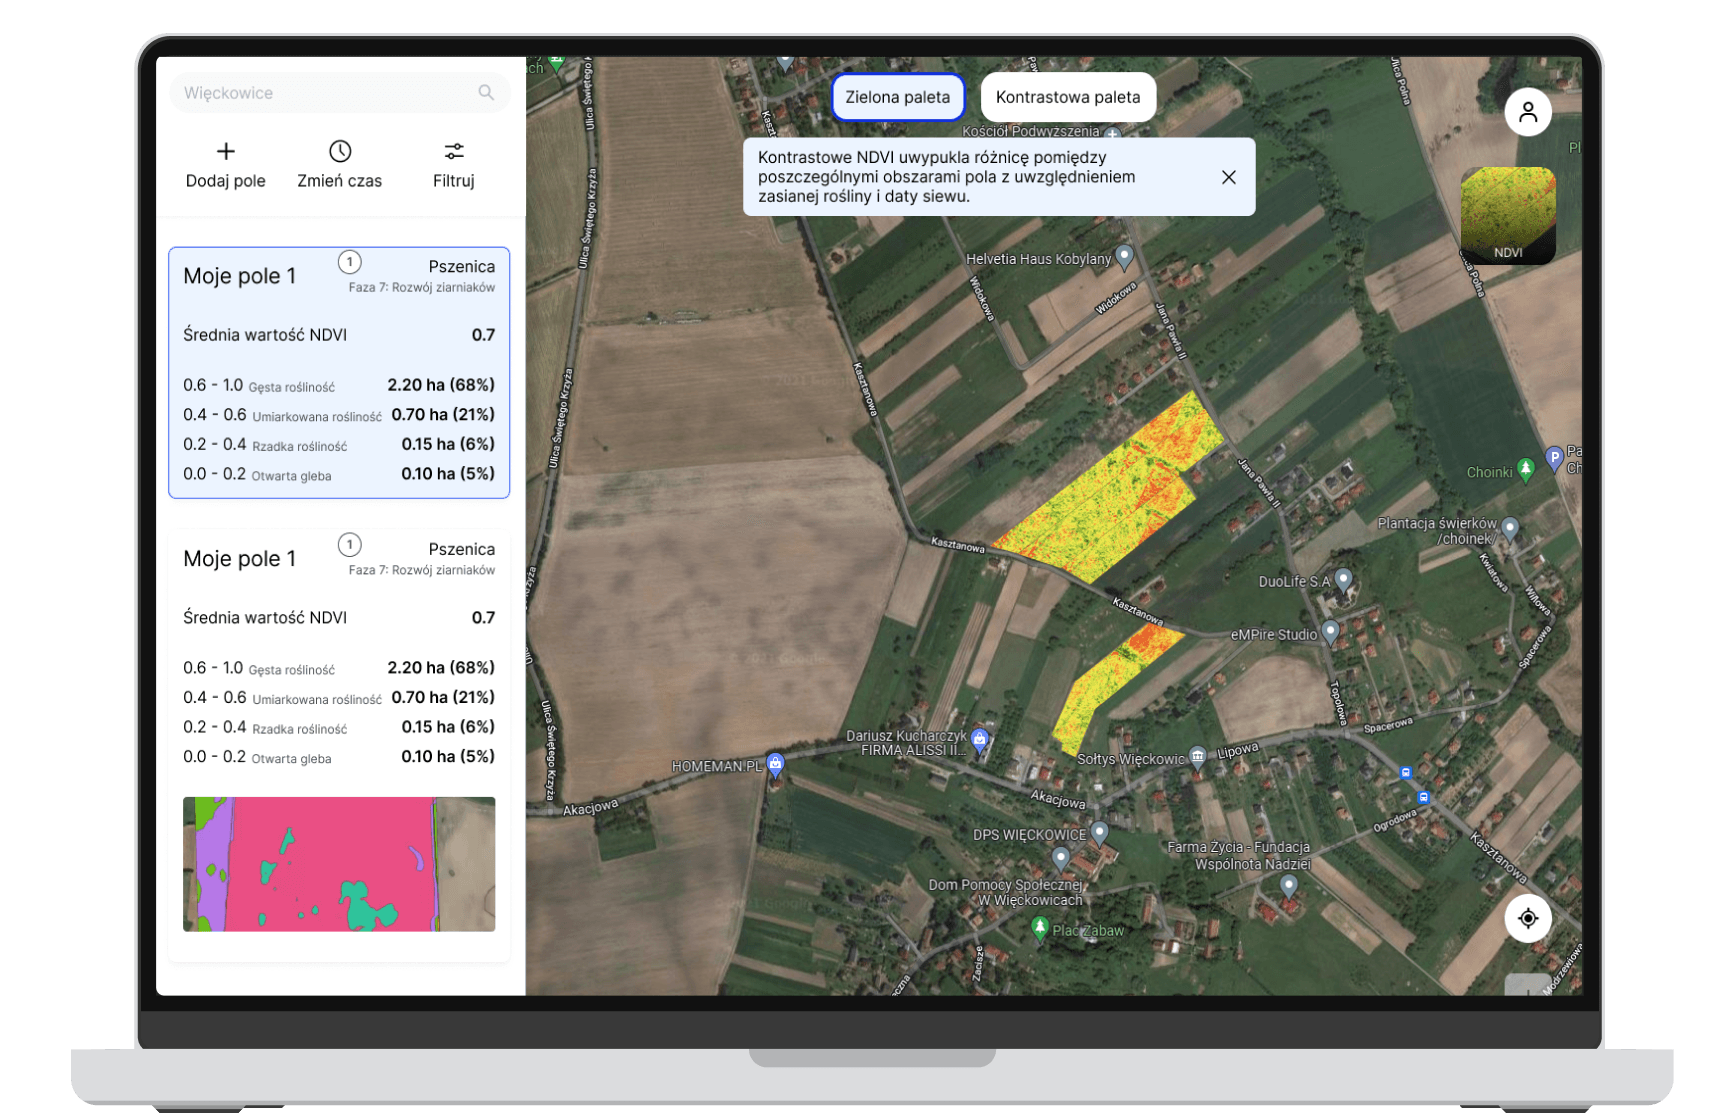
Satellite sensors (such as those on the Sentinel-2 satellites) capture images of fields in both the near-infrared and visible red bands, making it possible to calculate NDVI for every point in the field. The result is a color-coded map where green areas indicate healthy vegetation and red or yellow areas signal potential problems.
Examples of NDVI application — try MeteoTrack Agro
The NDVI vegetation index is used in many areas of agriculture and environmental management:
- Precision agriculture — creating variable-rate fertilization maps, monitoring crop growth dynamics throughout the season, and comparing vegetation condition across different fields or years.
- Irrigation management — identifying areas of the field suffering from water deficit and adjusting irrigation schedules accordingly.
- Crop damage assessment — quickly estimating the extent of damage caused by drought, hail, flooding, or pest outbreaks.
- Yield forecasting — NDVI values during critical growth stages correlate with final yield, making it possible to estimate harvest results in advance.
If you want to see how NDVI works in practice on your own fields, try MeteoTrack Agro. Our platform delivers up-to-date NDVI maps based on satellite imagery, so you can monitor your crops remotely and make better decisions — all in one place.
Summary
The NDVI vegetation index allows monitoring crop health based on satellite imagery — the higher the index, the more vigorous the vegetation. Regular NDVI analysis helps detect crop problems early and plan fertilization or crop protection precisely.